

Building Consumer Relationships in the $148 Billion Home Insurance Space
Jun 1, 2024|
Brand Breakdown
Welcome to the Brand Breakdown series, a monthly deep dive into the marketing strategies of leading global brands.
We’ll explore the winning and losing strategies that are pushing the boundaries of traditional marketing through the lens of owned asset optimization (OAO), a new approach to building consumer connection.
Subscribe today for unique insights straight to your inbox, exploring how the world’s most recognizable brands are connecting with consumers.
The homeowners insurance industry is fiercely competitive. With an estimated value of $147.8 billion, the industry’s biggest brands have massive marketing budgets for ads, sponsorships, and activations to capture a few magic moments of consumer attention.
But it’s the brands that convince homeowners they’re relevant and trustworthy that position themselves to capture the most market share.
In this three-part edition of the Brand Breakdown, we’ll explore consumer search data to reveal which insurance topics people care most about, which brands are meeting their needs, and how they optimize their owned assets to connect with audiences.
Brand marketing matters, but it’s not everything
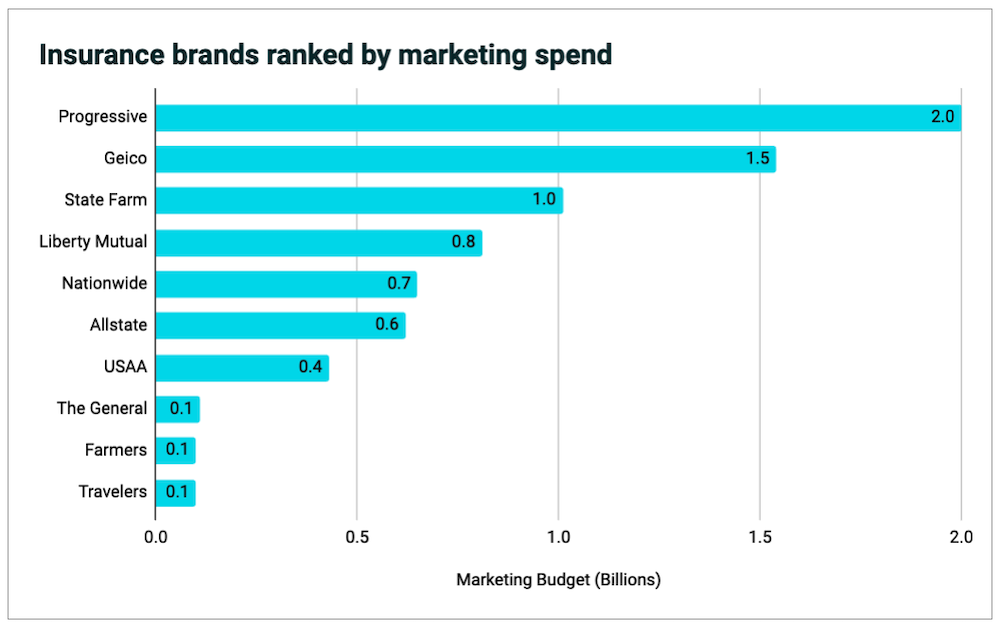
If someone asks you to name three insurance brands, you can probably rattle them off easily. That’s because brand marketing matters. It powers unaided brand recall and makes companies part of the social discourse so they’re top of mind when decisions are made.
The companies with the biggest marketing budgets (State Farm, Progressive, and GEICO) tend to have the strongest brands.
Source: Various
That leads to lots of branded home insurance searches, like “Progressive homeowners insurance” or “State Farm home insurance quote.”
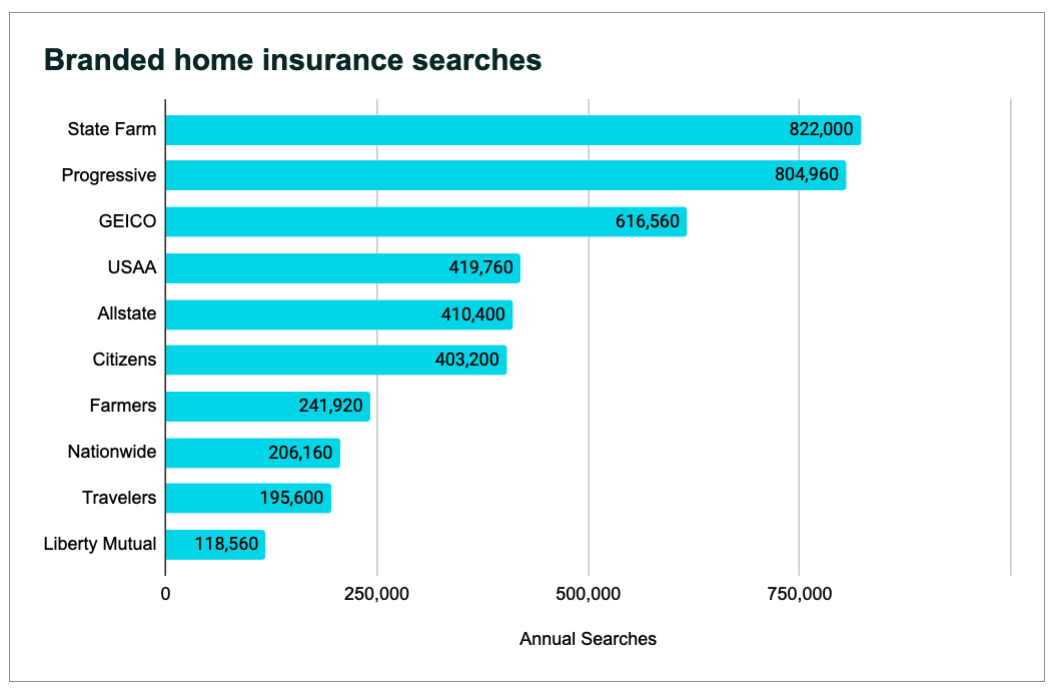
Source: Keyword volume data via Semrush
You might think that the brands that are top of mind for consumers would have the biggest share of premiums. But data for direct homeowners insurance premiums written reveals that Allstate earns more business than every competitor except for State Farm despite spending significantly less on marketing.
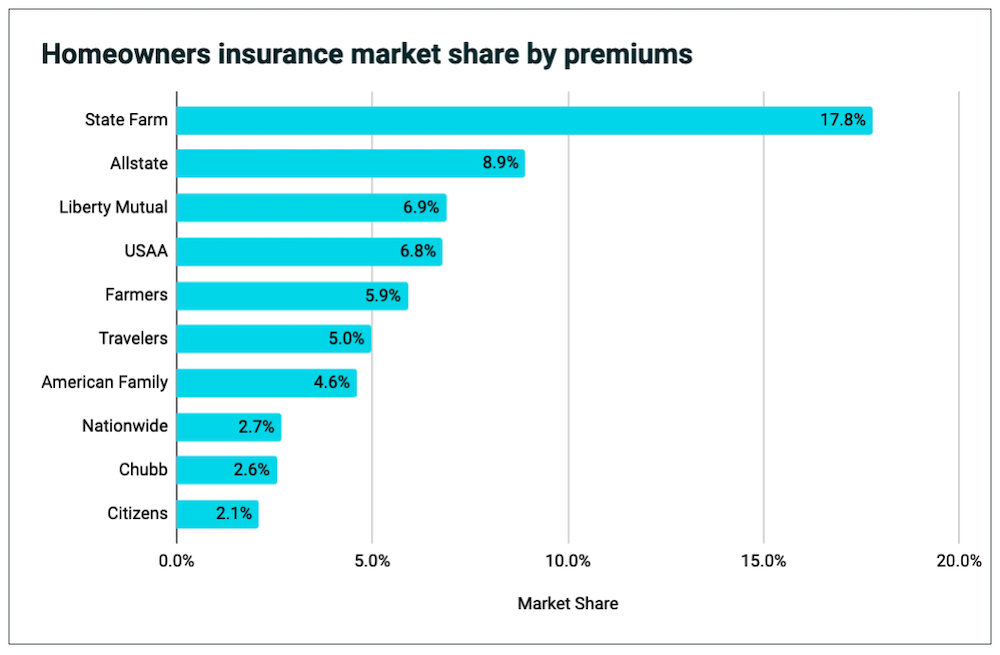
Source: NAIC
How does Allstate drive home insurance leads more efficiently?
They listen to the millions of questions consumers are asking in search and answer them better than nearly everyone else.
Source: Terakeet
Allstate builds trust with its audience by connecting early and often throughout the customer journey. Not all brand marketing is ad-based. These micro touchpoints that meet consumers in their moments of need create high-value brand impressions that stack up over time and accrue brand equity.
That’s marketing efficiency!
46 million opportunities to connect
Terakeet analyzed 46 million searches about homeowners insurance to find out what’s most important to consumers.
Surprisingly, despite the massive investment in brand advertising, 67% of all home insurance searches don’t include a brand name in the query. That means companies have 30 million opportunities to connect with new, in-market customers seeking answers.
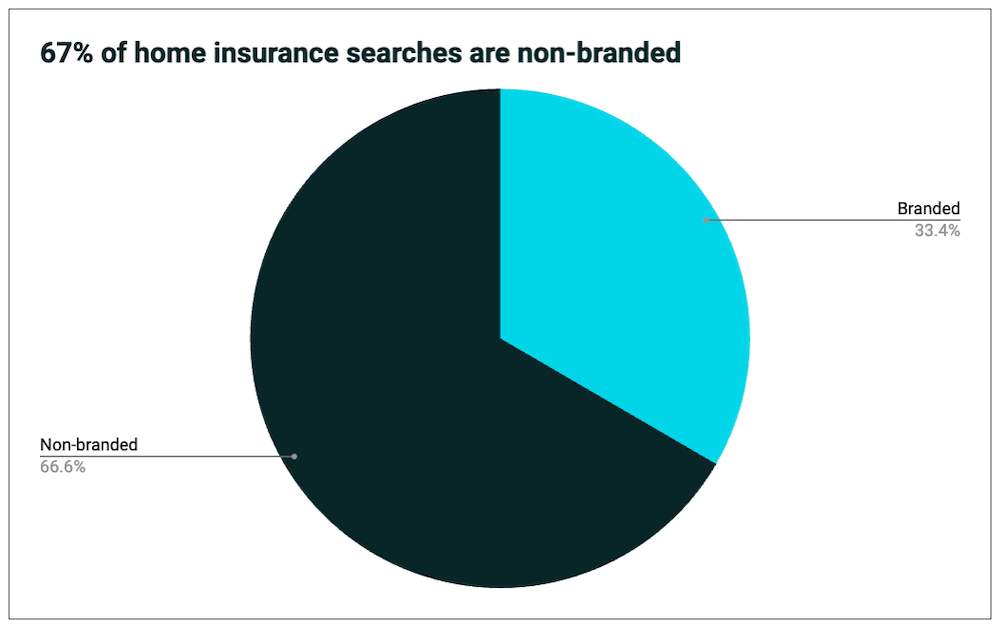
Source: Keyword volume data via Semrush
Among these non-branded searches, insurance companies control 62% of the organic search market share, losing 33% of the online journey to publishers and media brands.
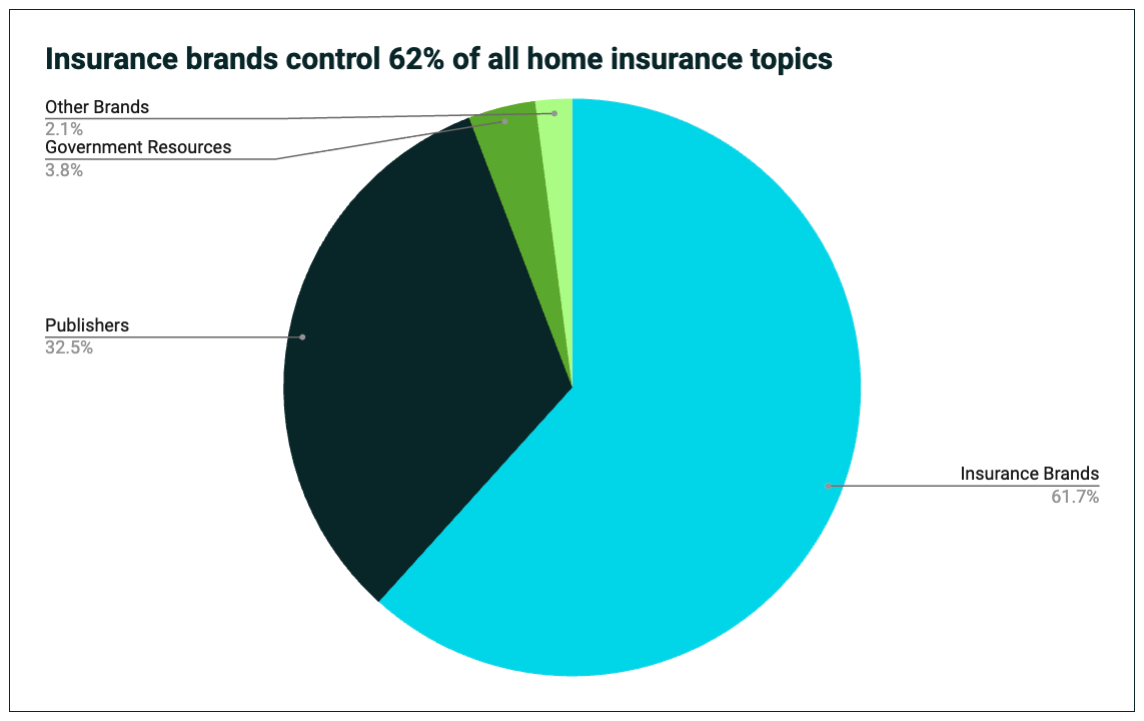
Source: Terakeet
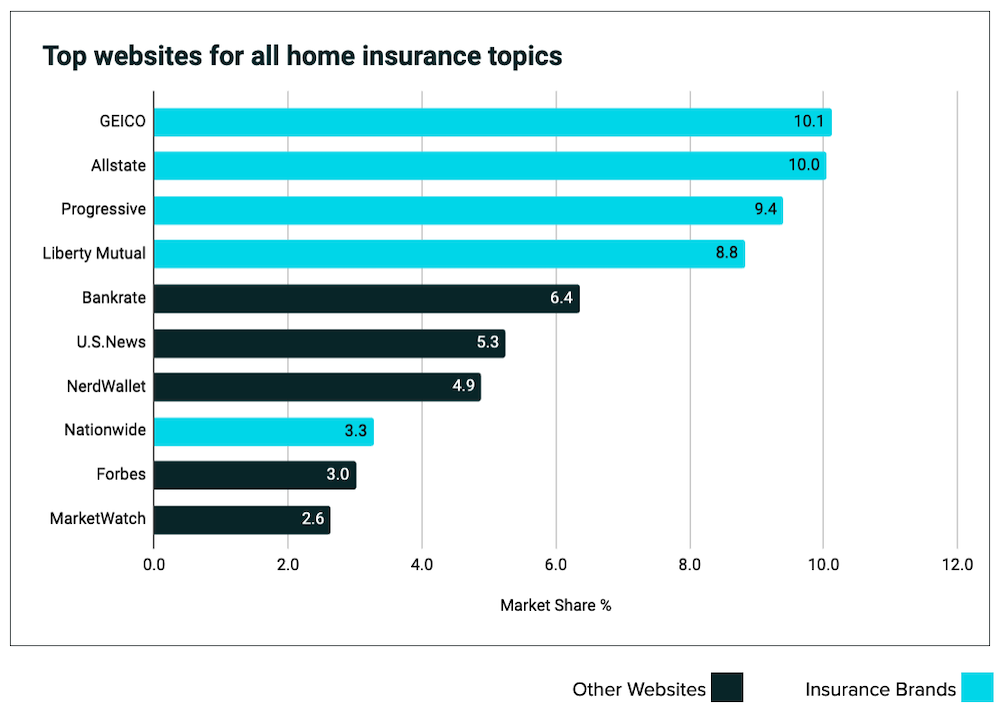
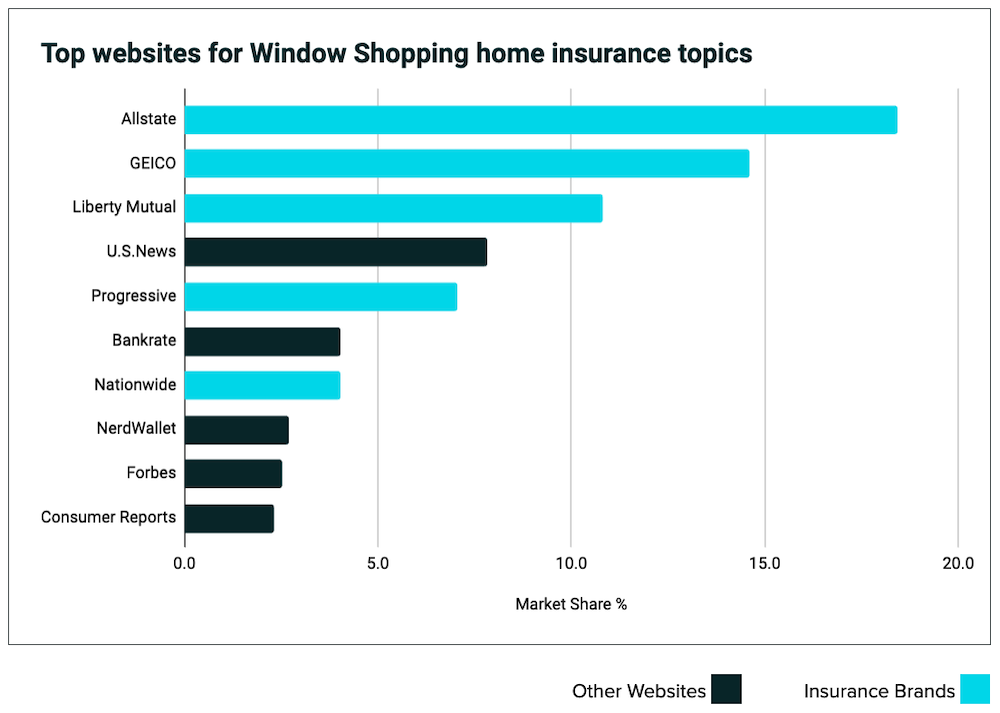
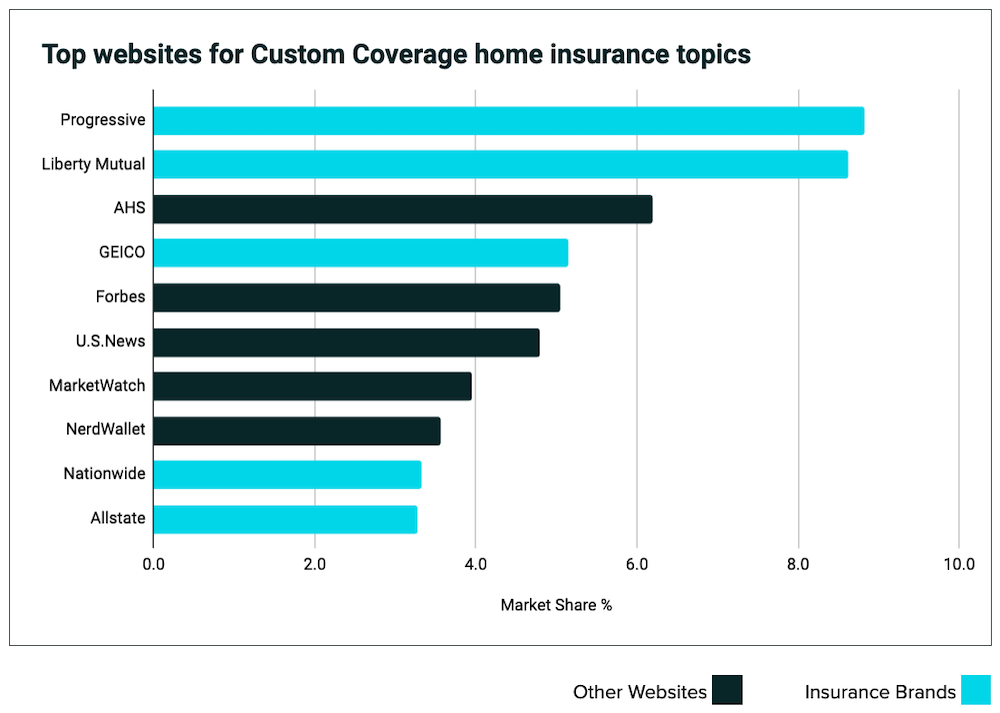
Although insurance brands control the largest slice of non-branded organic search market share, they only represent half of the top 10 websites in search results.
The other half is occupied by publishers like Bankrate, NerdWallet, and U.S. News, which send valuable leads to competitors and dilute profits through referral fees. On top of that, they rob brands of crucial trust-building touchpoints.
So how can home insurance brands continue to outperform publishers that write about similar topics?
Understanding what consumers want when they search online is the key to building authentic connections in the home insurance space.
By analyzing search data, we can uncover the questions people are asking in Google, segment them by need, and create customer-centric content that resonates.
Terakeet segmented non-branded home insurance searches into four groups based on consumer intent:
- Window Shopping
- Cost Conscious
- Custom Coverage
- Local Preference
This gives us a high-level view of what people care about when searching for insurance coverage.
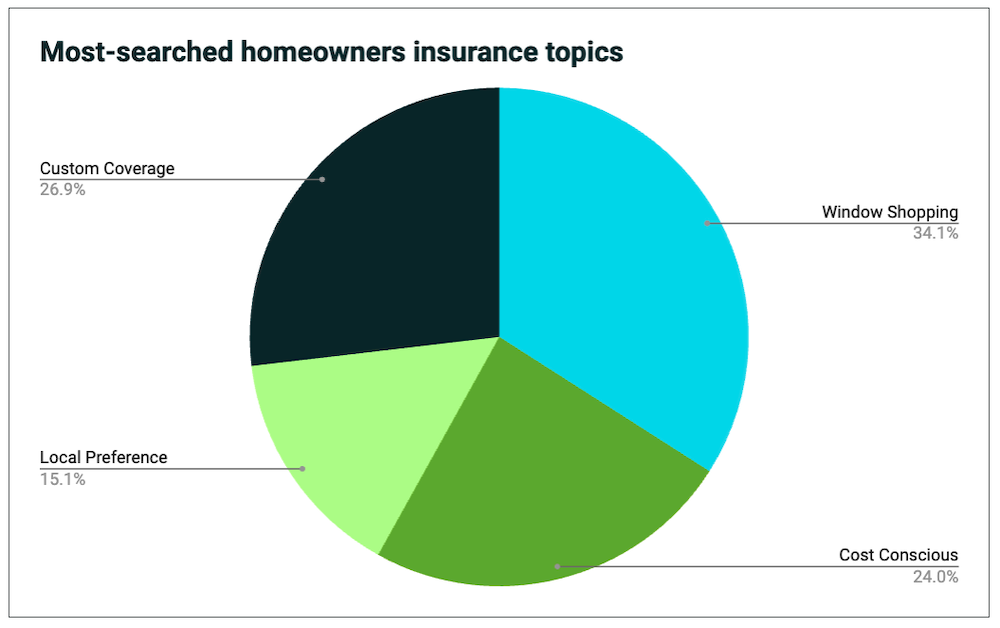
Source: Keyword volume data via Semrush
Connecting with consumers in the Window Shoppers segment
The Window Shopping segment includes people asking general “what is” questions about home insurance topics like liability, casualty, and hazard insurance. It also includes more transactional terms like “best home insurance companies.”
This segment is primarily seeking information or comparing brands rather than looking for specific types of coverage or asking for quotes.
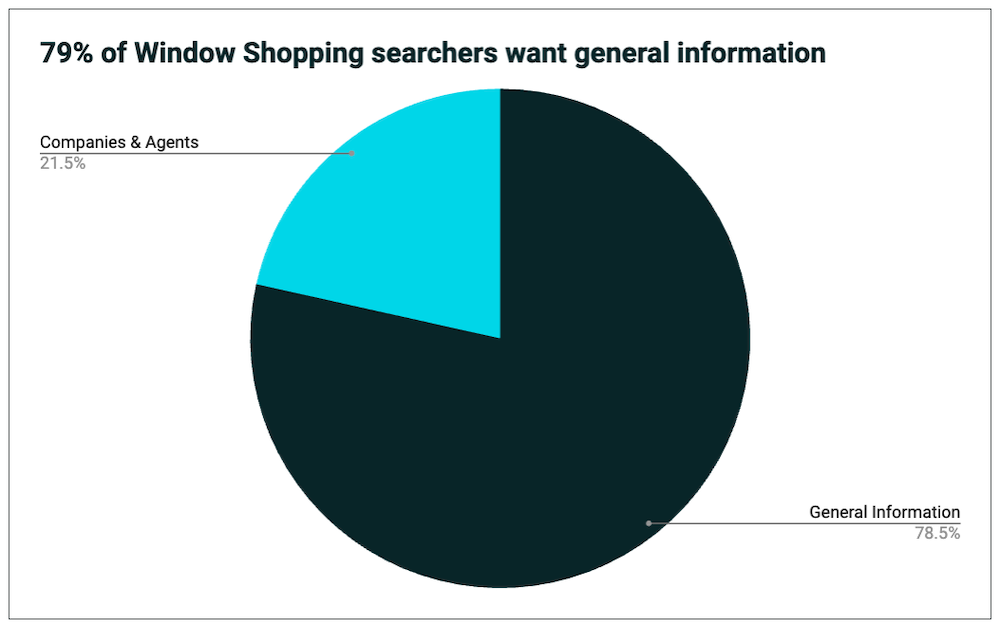
Source: Keyword volume data via Semrush
Insurance companies control 73% of organic search market share in the Window Shopping segment.
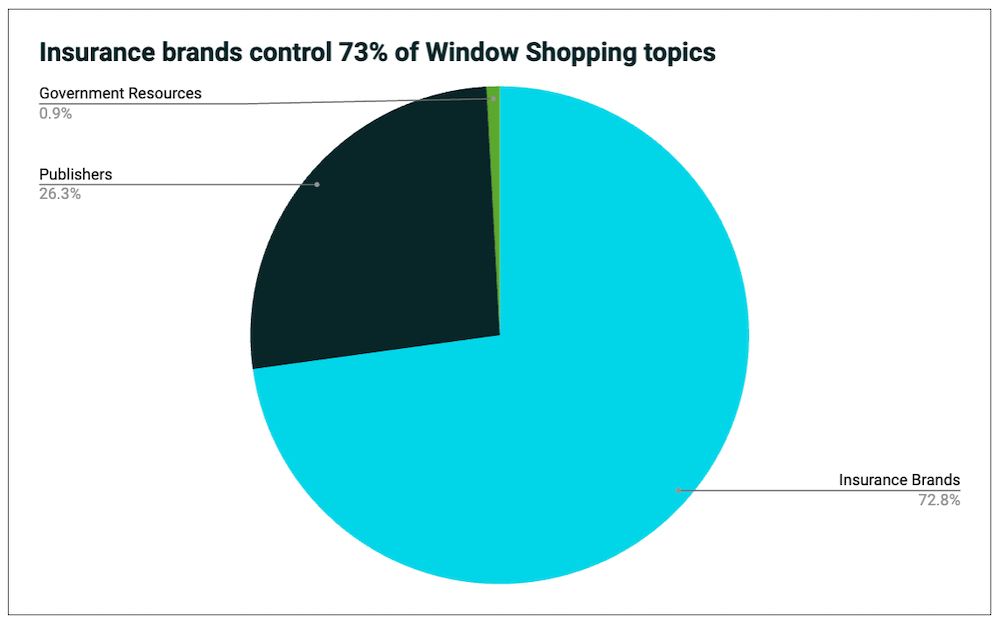
Source: Terakeet
Source: Terakeet
This is the segment where Allstate really pulls ahead and connects with consumers.
Connecting with consumers in the Cost Conscious segment
Cost-conscious consumers represented 24% of non-branded home insurance searches. That’s a powerful insight because pricing was much more important to people seeking auto insurance, accounting for 51% of all non-branded searches for that product category (check out our auto insurance breakdown for more on that).
You may expect the percentage of folks seeking cheap auto insurance would be similar to the percentage seeking cheap home insurance. But clearly, consumers have different needs when shopping for each type of insurance. It’s important to analyze consumer search data separately for each category to avoid making inaccurate assumptions.
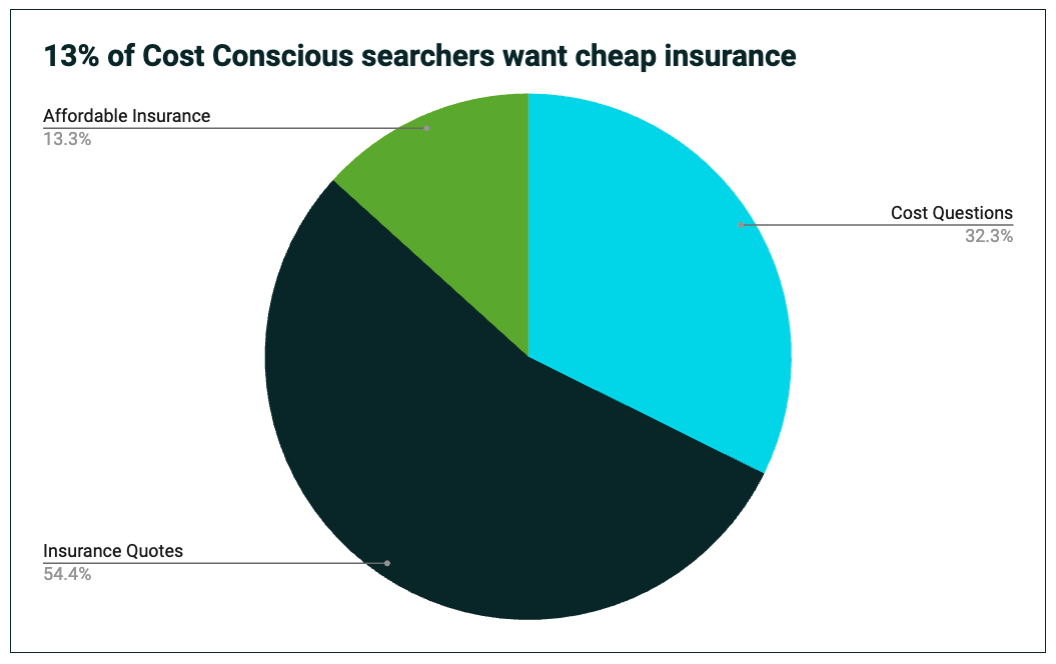
Zooming into the Cost Conscious segment, only 13% care about affordability compared with more than 45% of auto insurance shoppers. Most searchers just wanted quotes or had general cost and pricing questions.
By drilling into the behavior of home insurance buyers specifically, we learn about their unique journey. Equipped with this data, marketers are prompted to ask questions that can lead to more valuable, targeted assets.
Source: Keyword volume data via Semrush
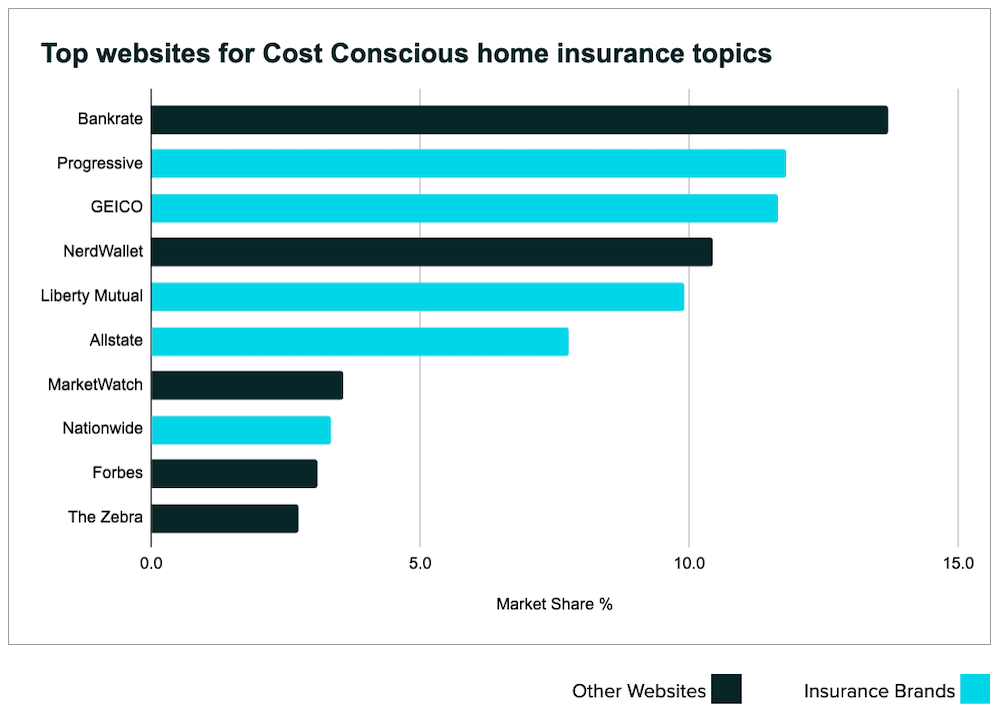
Although insurance brands control 57% of the organic search market share for cost topics, publishers like Bankrate and NerdWallet have a strong foothold here.
If affiliate websites capture too much search market share, they can send in-market customers to competitors or increase insurers’ acquisition costs through referral fees.
Source: Terakeet
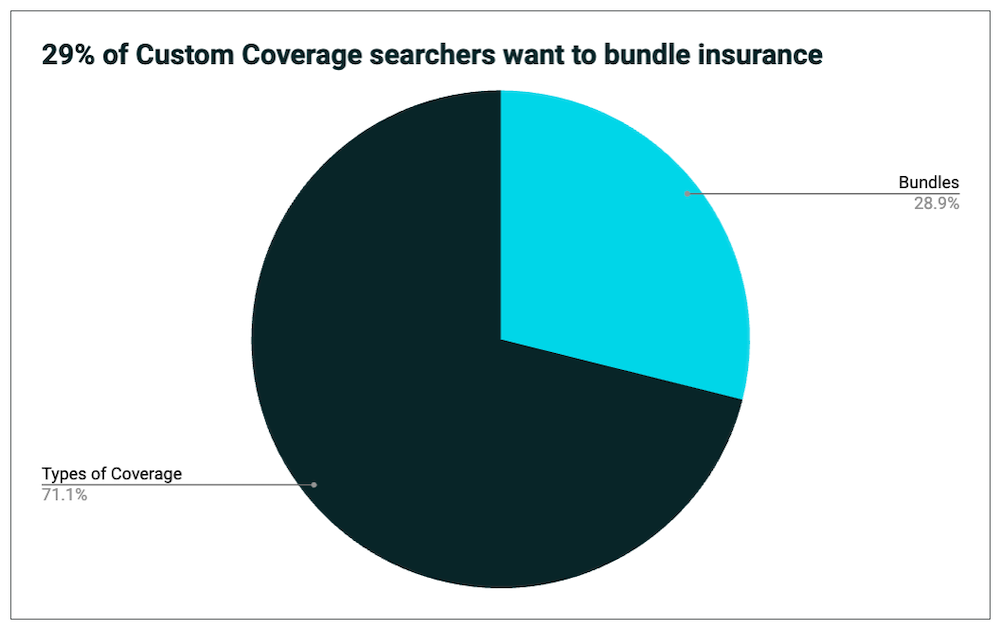
Connecting with consumers in the Custom Coverage segment
While some people are focused on cost, others are more concerned about getting the coverage they want. This segment is researching various types of coverage, including flood, fire, hurricane, earthquake, and home warranties.
They also want the convenience of bundling multiple types of coverage under one insurer. This group is more likely to pay a premium to get everything they want.
Source: Keyword volume data via Semrush
Insurance brands control 50% of the organic market share in the Custom Coverage segment. However, publishers and home warranty brands are threatening their visibility.
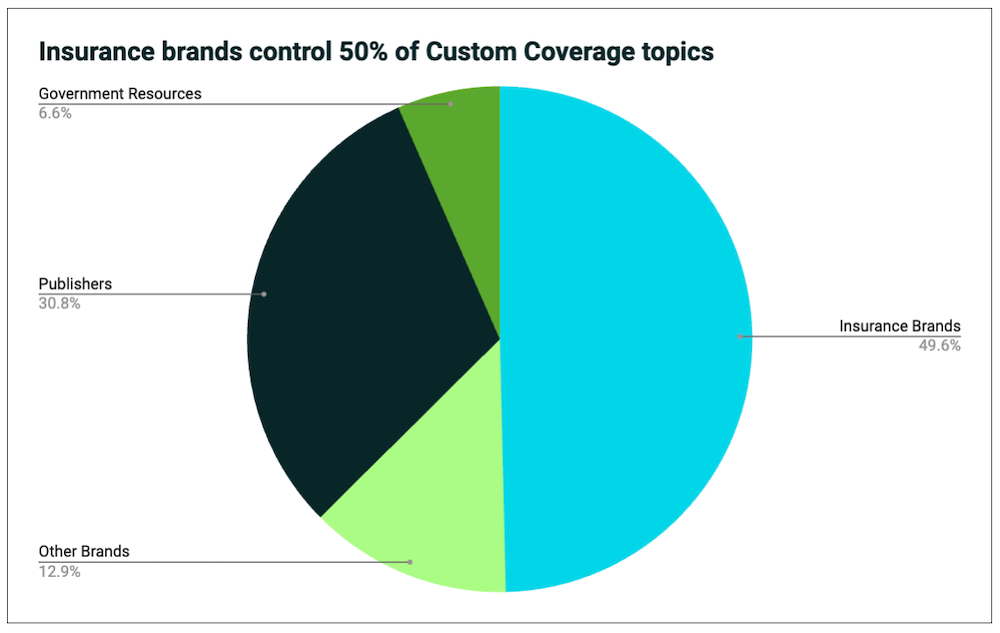
Source: Terakeet
Source: Terakeet
Although home warranties aren’t considered home insurance policies, there’s plenty of interest in these products.
Home warranties are a growing trend with inconsistent search interest likely driven by media buying. More than 11 million people each year search for home warranty information, and searches for “home warranty” have surpassed searches for “home insurance” more than once.
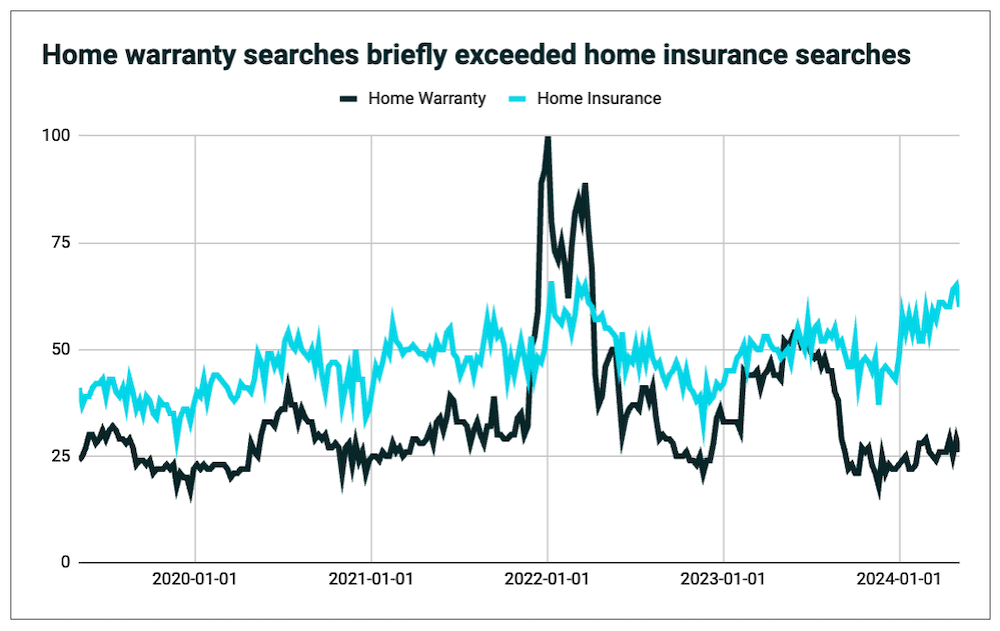
Source: Google Trends
This indicates the confusion between warranties and insurance in consumers’ minds, presenting a huge opportunity for insurance brands to clarify these products by providing valuable, trustworthy information about the pros and cons of home warranties.
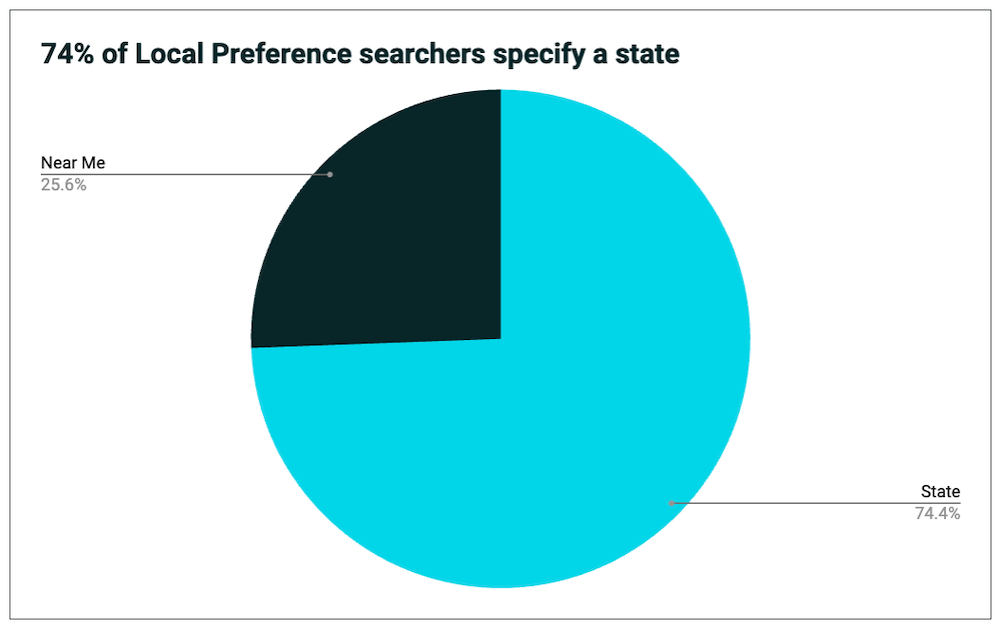
Connecting with consumers in the Local Preference segment
The Local Preference consumer segment cares most about location. About 26% of this segment uses terms like “near me,” indicating they want a hyper-local agent. This customer group likely prioritizes personal relationships and is very loyal to brands that meet their needs.
Nearly 75% of this segment searches for companies using state-specific keywords. This group wants a provider that understands the unique needs of their state, including legal requirements and special types of coverage they may need. For example, California residents may want fire insurance, while Florida residents may want flood or hurricane insurance.
Source: Keyword volume data via Semrush
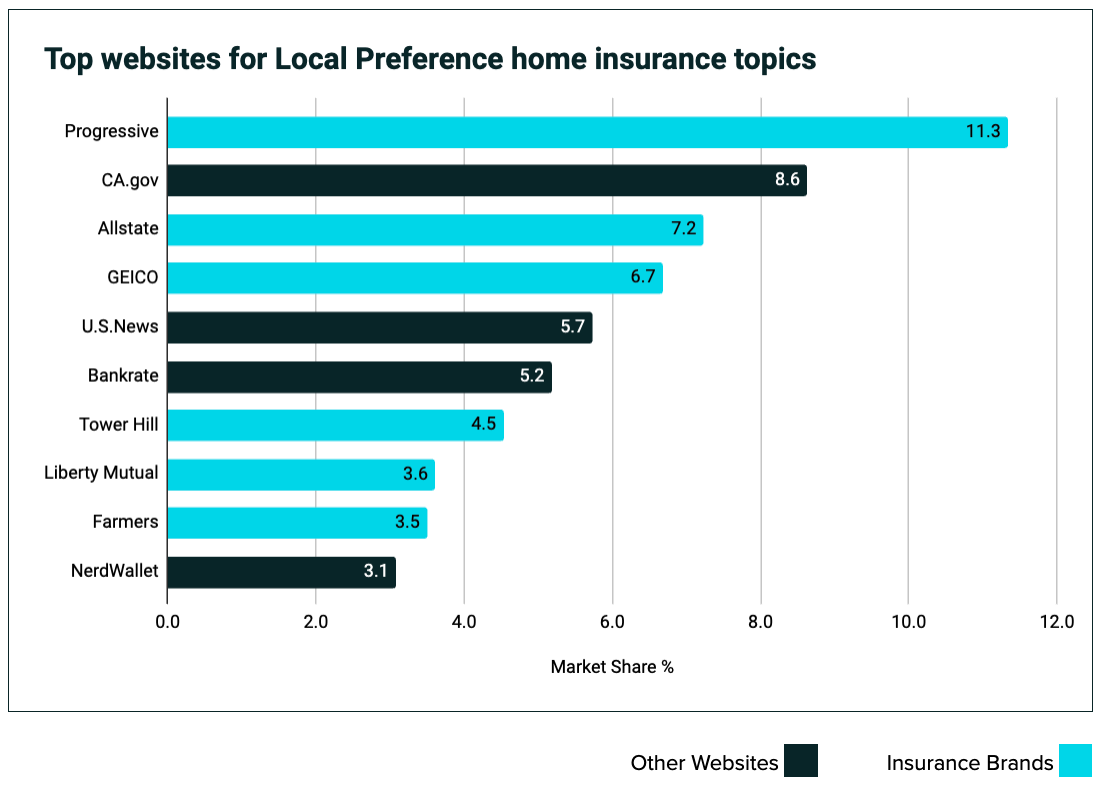
Insurance brands control 60% of the search market share for Local Preference consumers, but publishers and government resources also outperform many brands.
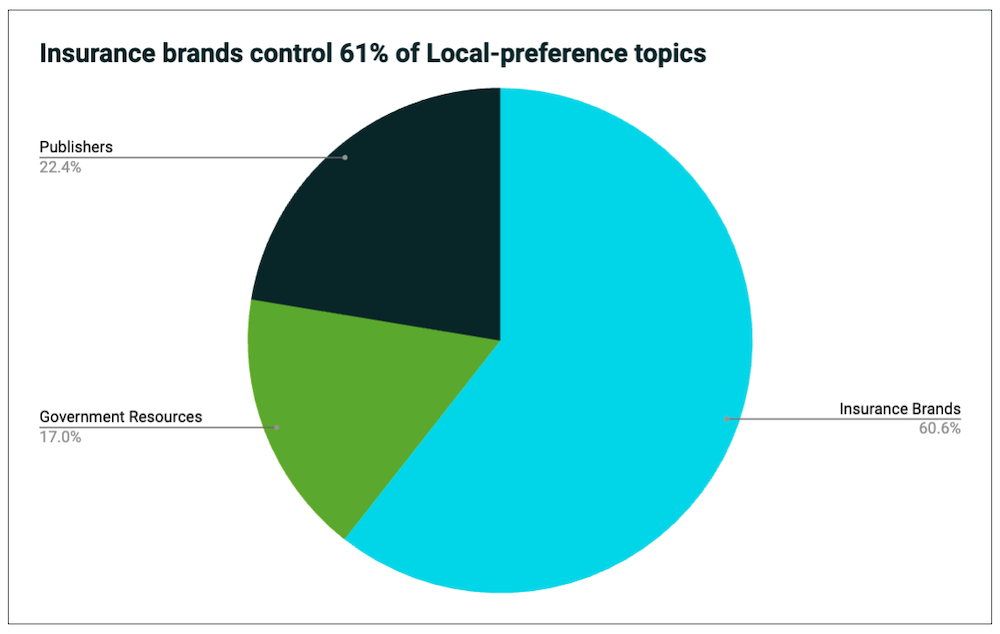
Source: Terakeet
Source: Terakeet
As a marketer, it’s crucial to understand how your audience searches. Rather than interrupting potential customers with brand advertising, this data reveals how engaging them through reception marketing provides real value by answering their questions.
Now that we understand the most important topics consumers are searching for around homeowners insurance, we can build a strategy to connect.
Multi-million dollar strategies of the top 10
Terakeet estimates the top 10 insurance brands collectively generate about $237 million annually from their websites just through non-branded organic home insurance searches.
A note about revenue estimates: Our proprietary technology estimated the organic traffic each owned asset earned in Google. Then, we applied a conversion rate of 1.25% and a conversion value of $2,000 per policy to estimate the annual revenue each brand earns through organic search for non-branded home insurance queries.
Allstate’s Window Shopper strategy
Window Shopping customers are the largest segment by search volume, with Allstate winning 18.4% of market share in this segment. These searchers want general information about homeowners insurance and information about the companies they can consider buying from.
Window Shoppers are still looking for options and aren’t ready for a quote just yet, but some of them are close to making a decision.
To reach people asking questions about the difference between homeowners, property, casualty, and hazard insurance, Allstate published several informational resources that clearly explain each term.
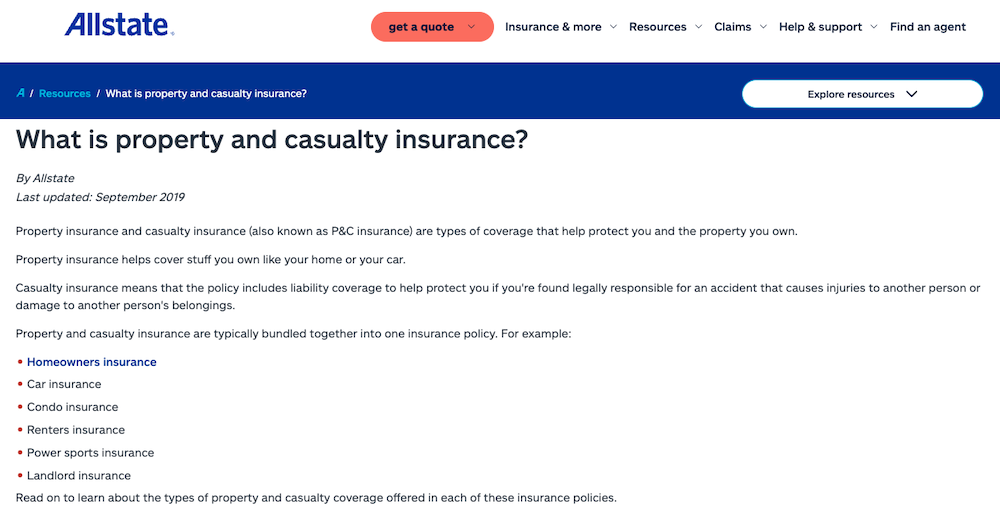
Source: Allstate
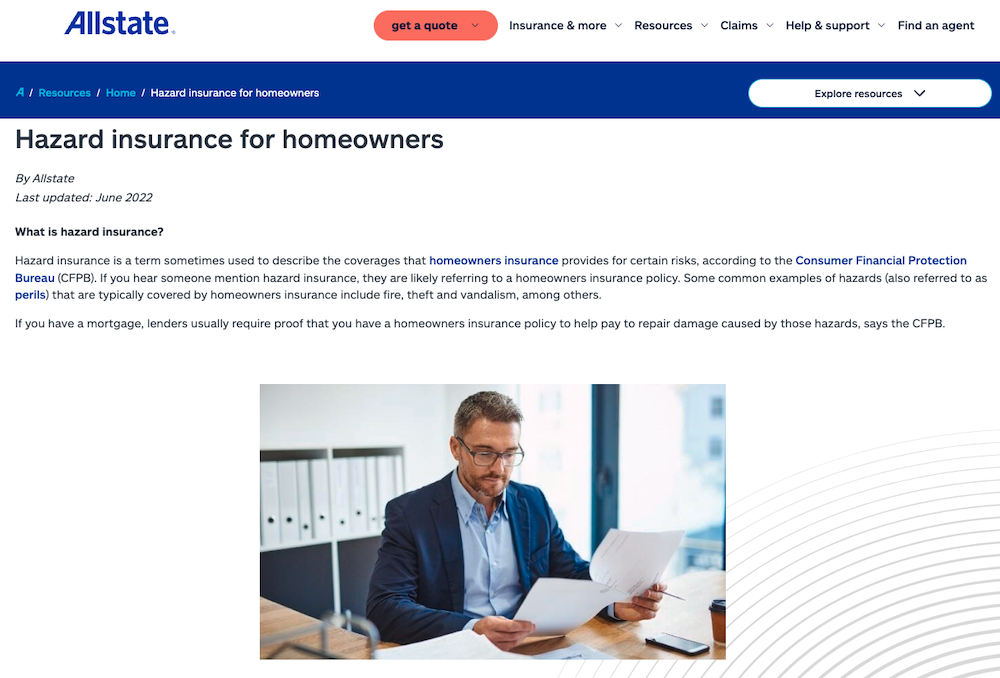
Source: Allstate
To reach Window Shoppers closer to the point of conversion, Allstate’s home insurance page gives them every resource they need.
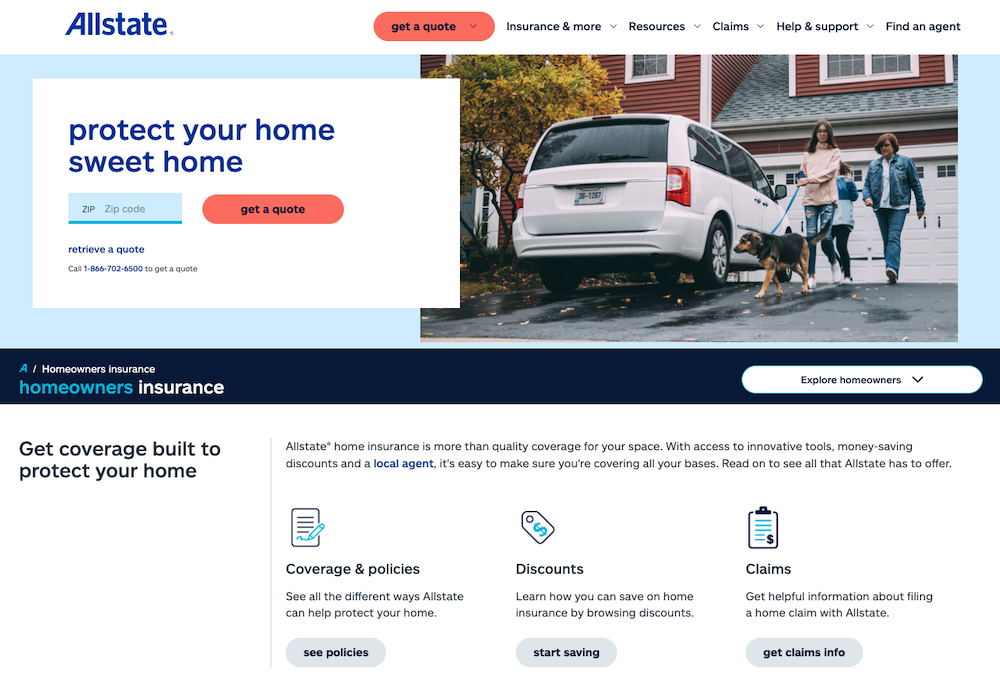
Source: Allstate
This is a valuable owned asset, optimized with several buttons to get a quote, a field to enter your ZIP code, an explanation about how an agent can help, and even links to content about related coverage types and discounts. This page is not only an informational hub about homeowners insurance but also a conversion point for folks who want a quote.
These three pages alone generate an estimated 14,000 annual home insurance policies through organic search. But Allstate has more than 90 owned assets that drive home insurance traffic.
Collectively, these assets generate more than 25,000 policies each year just through organic search, worth about $49 million.
Progressive’s strategy for the Local Preference segment
Local Preference customers want an insurance provider that understands them. They seek relationships with nearby agents and companies that understand their needs based on which state they live in.
Progressive has a fleet of owned assets optimized to connect with people all across the country searching for insurance in specific states. These pages don’t just list agents’ names and phone numbers.
The content offers in-depth information about coverage each state requires, specific perils and hazards not covered on a standard homeowners policy, and related articles and resources to explore, all curated by location.
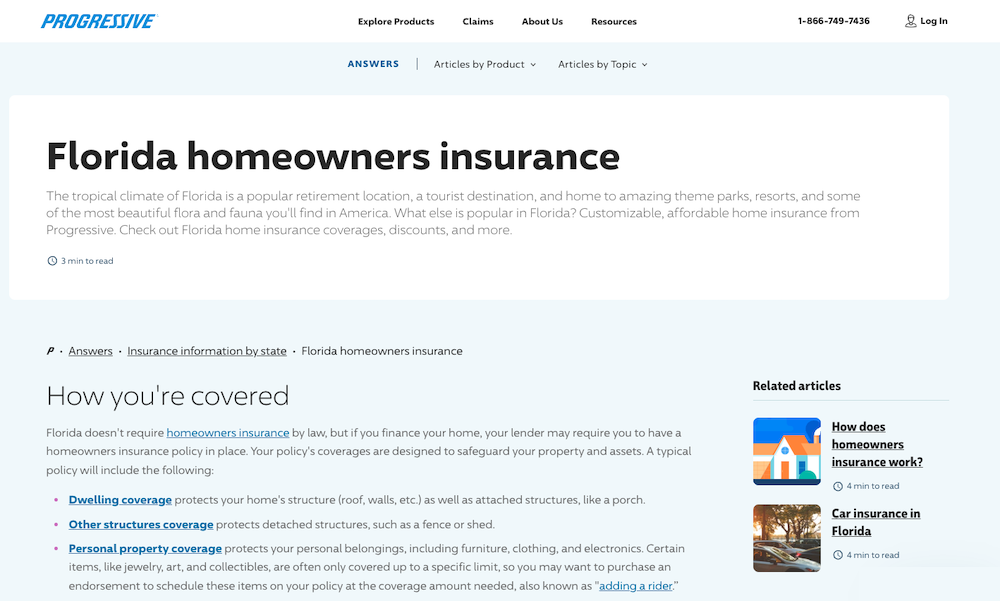
Source: Progressive
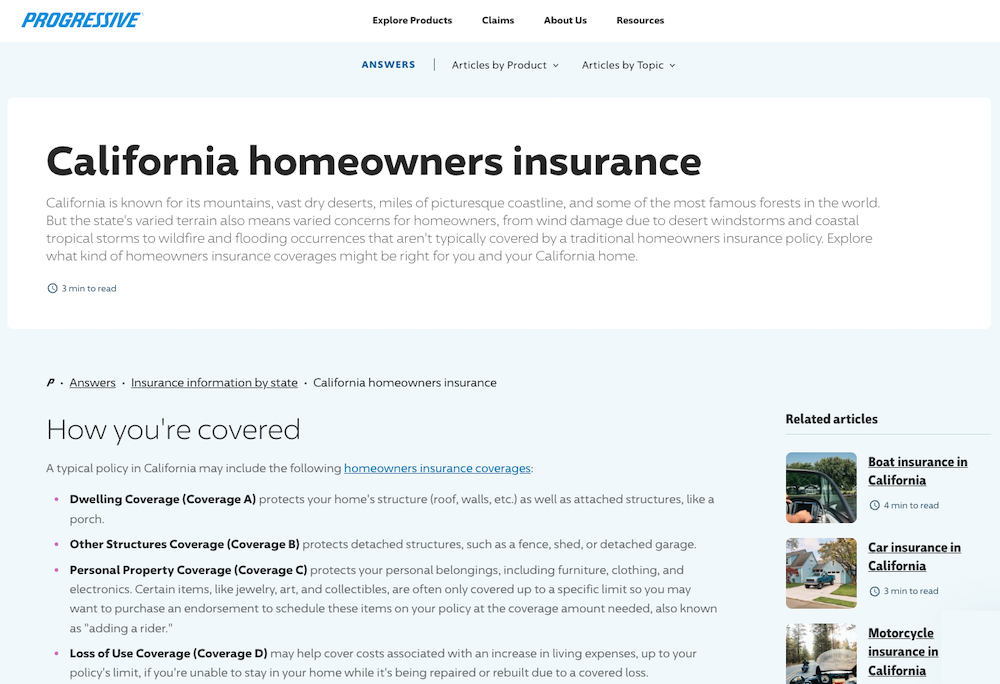
Source: Progressive
Progressive has more than 30 owned assets driving traffic and revenue in the Local Preference segment that bring in about 4,600 policies each year. But across the entire homeowners insurance category, Progressive has 107 pieces of content that could generate 23,000 policies through organic search each year, worth more than $46 million.
Liberty Mutual’s Custom Coverage strategy
Custom Coverage seekers prefer to have more control over their policies. They want specific types of coverage, as well as the convenience of managing these policies together. But they also care about saving money through bundling, which means they share some attributes with the Cost Conscious segment.
Liberty Mutual has 35 pieces of content in the Custom Coverage segment, and it controls 8.6% of the segment’s search market share. Its strongest owned asset here is its bundling page.
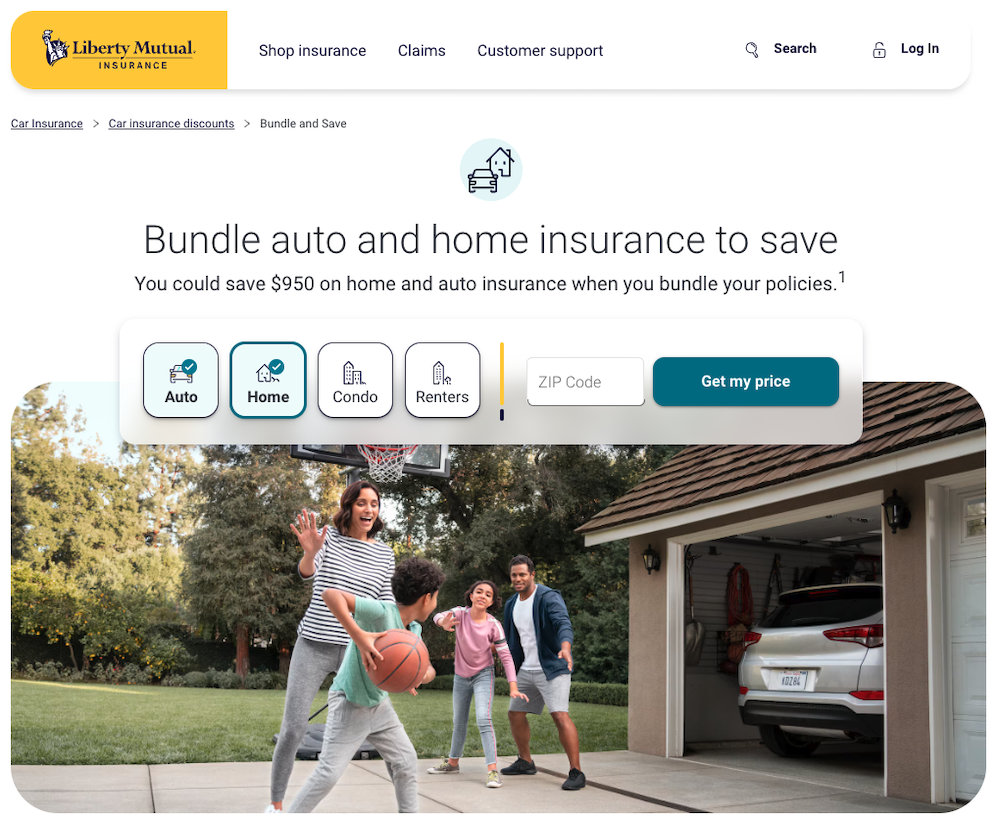
Source: Liberty Mutual
This piece of content shows potential customers that combining coverage like home and auto saves money, removes friction, and offers flexibility.
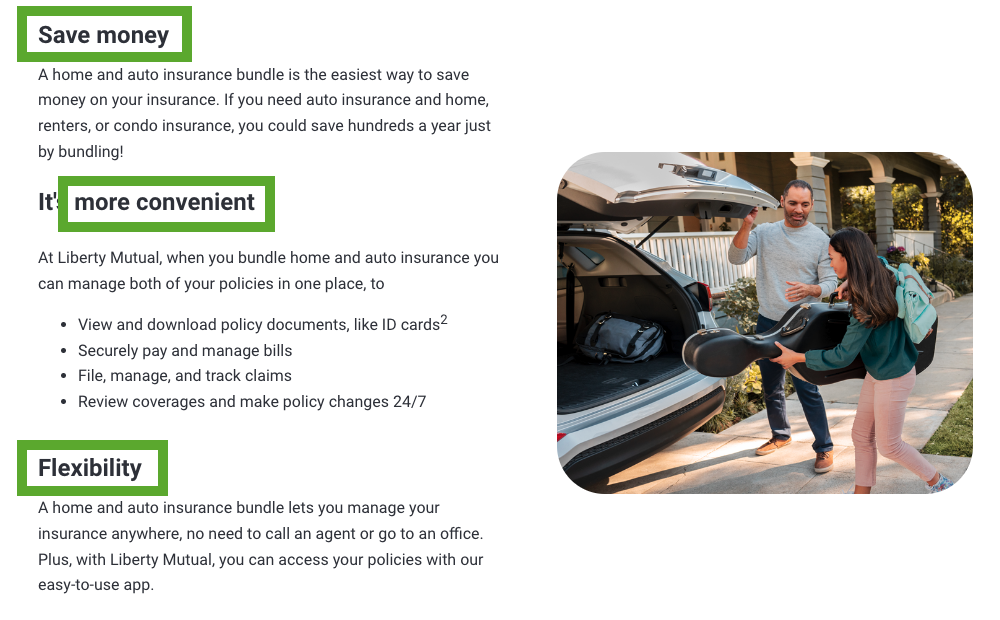
Source: Liberty Mutual
But the marketing team at Liberty Mutual understands that customization is important for this customer segment, so it masterfully wove that language throughout other pieces of content too.
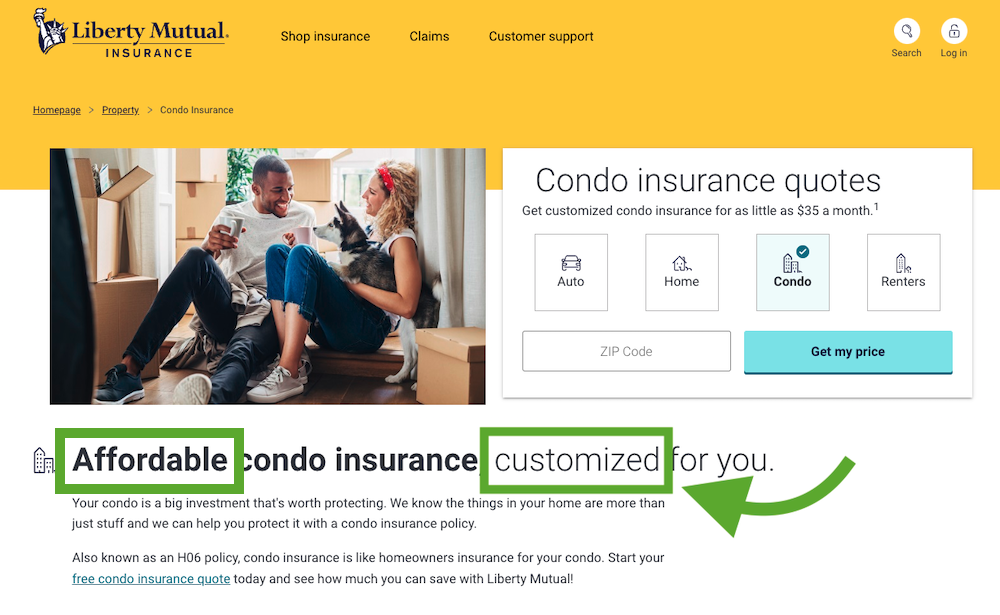
Source: Liberty Mutual
Liberty Mutual also has plenty of articles in its resource section about what is and isn’t covered by homeowners insurance, including content about home-sharing, mold, and flooding.
In total, the brand’s Custom Coverage content brings in nearly 5,400 policies each year. But Liberty Mutual has more than 60 pieces of content about home insurance that win organic traffic. These owned assets earn about 23,000 home insurance policies each year worth an estimated $46 million.
Progressive’s Cost Conscious strategy
Progressive does a remarkable job meeting the needs of the Cost Conscious consumer segment. The brand boasts 21 owned assets and controls 11.8% of the search market share in this segment. Its primary home insurance page is packed with language that resonates with frugal shoppers, including words like save, discount, and affordable.
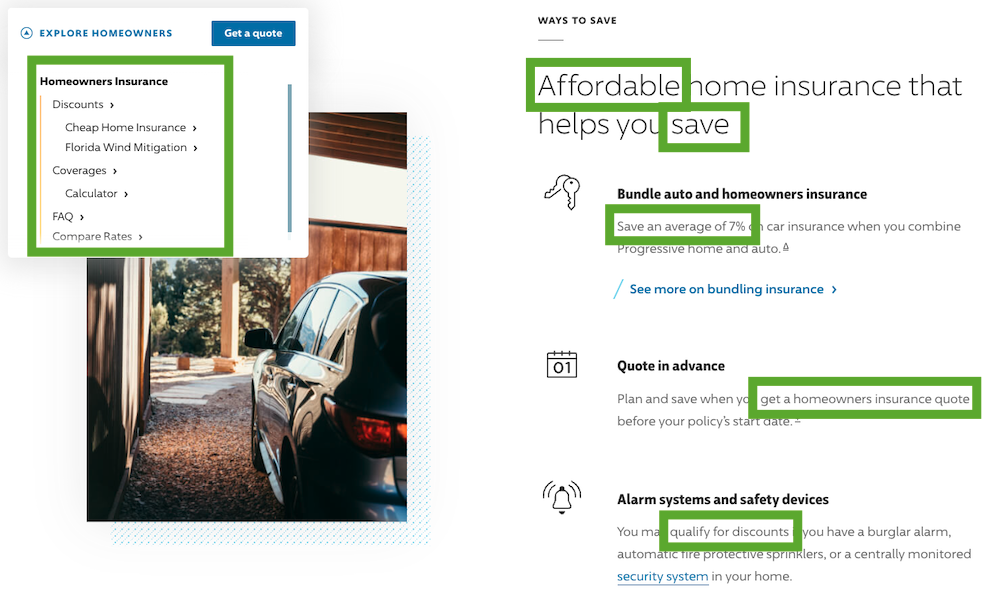
Source: Progressive
In addition, Progressive offers a tool to compare rates across multiple insurance companies, helping consumers find the best rates.
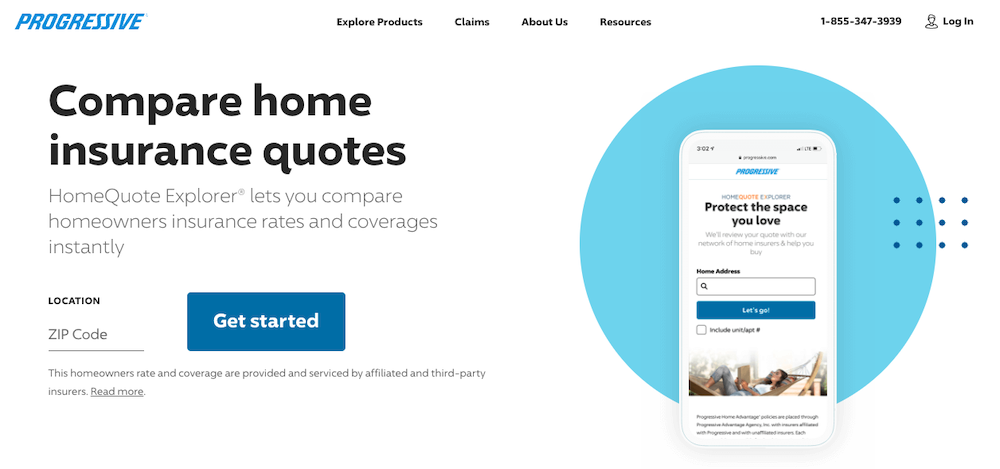
Source: Progressive
Curious how your state stacks up against the average cost of home insurance? Progressive has content that answers that question, too. It even explains the factors that impact your rate.
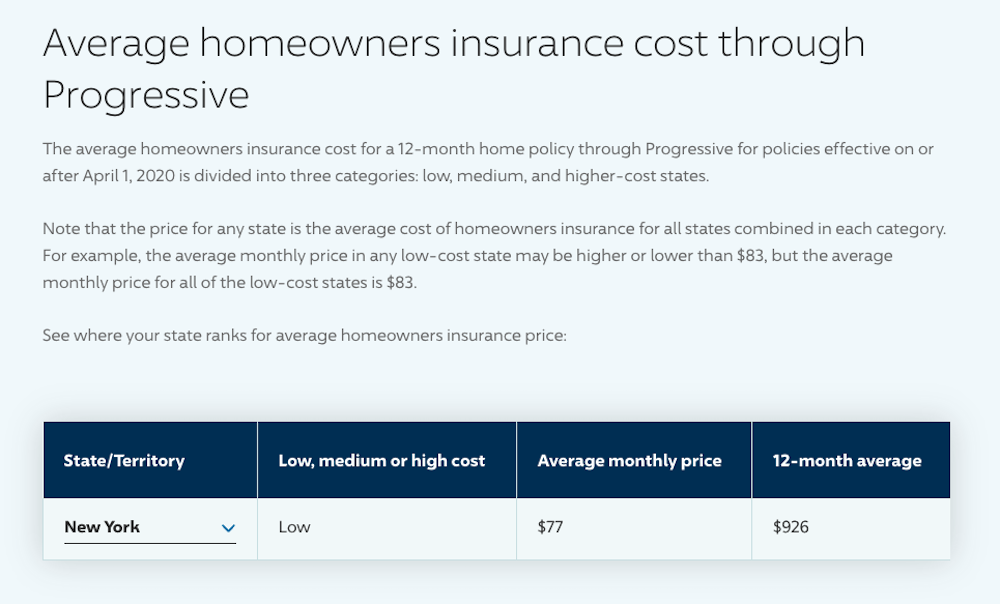
Source: Progressive
What about a calculator to build a custom rate based on your needs? Yep, they have that too!
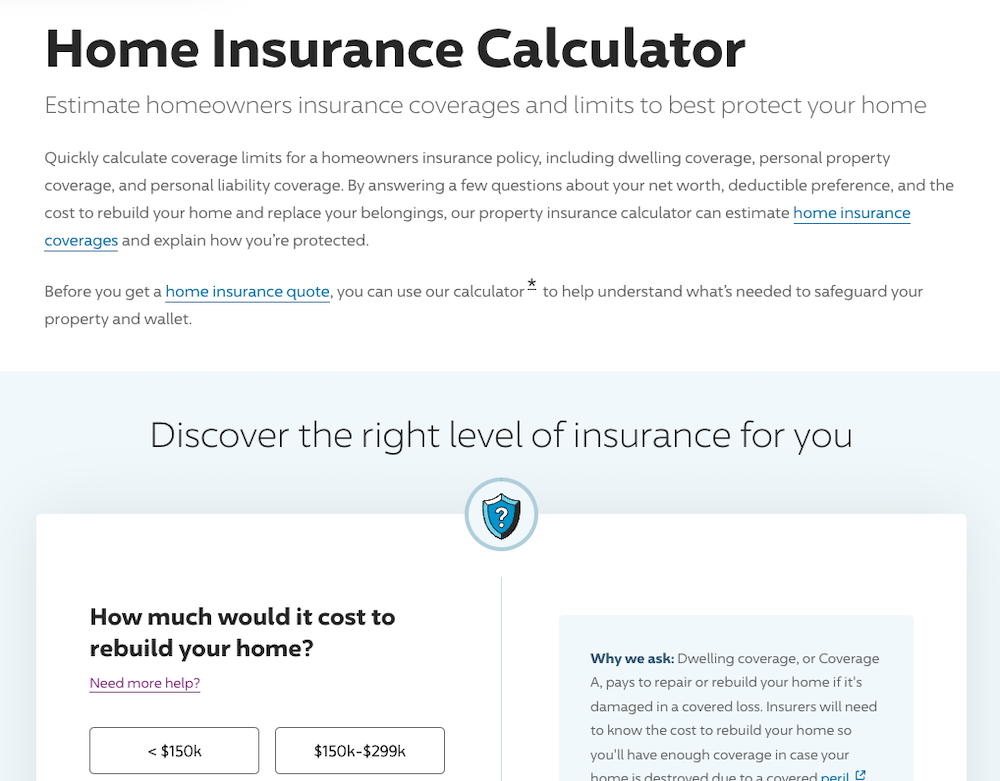
Source: Progressive
Progressive even has content about cheap homeowners insurance, the cost of flood insurance, and the costs of replacing a home after a disaster.
Progressive’s Cost Conscious home insurance content helps generate more than 7,000 annual policies by connecting with consumers.
Listen to unlock authentic connections
When consumers search for information online, they’re telling you exactly what they want. As marketers, if we can understand the intent behind search data, we can create better content experiences that meet their needs when they’re most receptive.
These valuable owned assets build brand equity, nurture customer relationships, fuel revenue, and reduce acquisition costs.


Learn how consumer insights can drive consumer connection
What We DoUnlock instant access to 25+ digital marketing resources and the OAO 101 introductory email course to kick start your strategy.