
Rethinking the Total Addressable Market (TAM): A New Application for Brands
Dec 19, 2024|Read time: 8 min.
Key Points
- By rethinking the traditional TAM model within the online search landscape, brands can uncover fresh opportunities and gain deeper customer insights.
- Brands can leverage search data to gain a more precise understanding of market share, estimate competitor performance, and drive revenue.
93% of shopping journeys begin online, granting marketers unprecedented access to trillions of consumer data points. By decoding these insights we can:
- Measure total product demand in real time
- Uncover new consumer need segments
- Calculate market share across the entire competitive landscape
- Discover new opportunities for business growth
But to make sense of the data, you need a framework — one that allows you to determine the total search demand within your industry and filter that demand to reflect your brand’s specific business strategy.
Sound familiar? That’s because it’s similar to the concept of total addressable market (TAM). By reimagining the TAM framework through a digital lens, you’ll unlock powerful insights that enable more strategic decision-making and greater speed to action.
Reframing Total Addressable Market around search data
As a marketing leader, you probably already know that total addressable market (TAM) estimates the maximum revenue opportunity within an industry, and serviceable addressable market (SAM) estimates a specific company’s opportunity based on its capabilities.
Marketing term
Total Addressable Market (TAM)
The maximum revenue opportunity within your industry’s market.
We can easily apply this framework to search data. But first, it’s important to recognize a key difference: searches are not the same as customers.
- A single potential customer often performs many searches throughout the buying journey.
- Search data only reflects demand from people actively using search engines.
In other words, don’t think of each search as a single customer. Instead, think of search data as a metric to measure the level of demand for a product within a specified timeframe.
Search data tells you how big the demand is, what problems consumers are trying to solve, and which brands are most visible when consumers are seeking solutions.
Here’s how search data fits into the TAM model.
Total addressable market (TAM) — Total number of Google searches about topics related to an industry.
- Example: Total searches related to insurance
Serviceable addressable market (SAM) — A portion of the TAM that is relevant to your business.
- Example: Searches related to home and auto insurance across the 12 states you service
Benefits of knowing your TAM
By applying the TAM framework to search data, we gain access to macro and micro insights that reveal high-level business growth opportunities, crucial consumer needs, and tactical competitor strategies.
Let’s look at some of the most important benefits of analyzing your TAM.
Measure total market demand and trends
Each year Google processes about three trillion searches from curious consumers. When you filter out the noise you can uncover millions of valuable consumer questions related to your industry. This gives us a snapshot of the total search demand within an industry at a moment in time.
We can also track changes in search demand over time and compare it against consumer trends, economic events, seasonality, or news cycles to learn more about what’s driving interest and how to predict future trends rather than react to them.
Segment and analyze audience needs in real-time
Although it’s useful to know the total search demand available within your market, it’s hard to act decisively without more information. When you create custom, composable segments from your search data, you can learn:
- Which business lines have the greatest consumer demand?
- How many distinct customer need segments are there, and which ones are the largest?
- How much opportunity exists among your most profitable business lines?
Create as many segments as you need, including business lines, cost, location, product features, color, size, pain point, etc. If the data exists, you can segment it.
Share the insights with stakeholders to inform new product features, guide business investments, improve sales collateral, and arm customer success teams.
Calculate market share across the entire competitive landscape
Market share is a critically important indicator of your company’s dominance within your industry. But it’s incredibly challenging to estimate your own share of the market, let alone all of your competitors because you don’t have insight into their sales.
But search data circumvents that weakness and it’s among the most accurate market share prediction models you can use. Here’s why the model is so strong.
- We know how many people search for each keyword
- We know the ranking positions of each website for each keyword
- We know what percentage of users click through to a website for each ranking position
- By aggregating all the data we can calculate the percentage of clicks each website earns out of all available clicks
But we can push the data beyond traffic. If you build conversion rate and average order value into your model, you can also estimate the total organic search revenue for each competitor.
Then, you can apply the calculations to any of the segments you created to see how competitors perform at a more granular level.
Translating TAM to business intelligence
Now that you’ve seen the power of applying search data to your total addressable market, I’ll show you how to translate the insights into actionable business strategies. Let’s look at Terakeet’s recent TAM report for the insurance industry for some examples.
Uncover brand strength in your industry
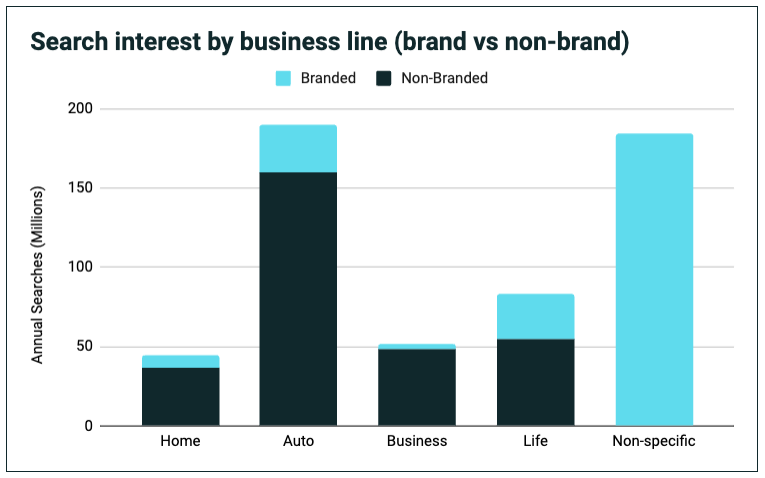
When we looked across 554 million annual searches, we discovered that consumers seeking insurance only search for specific brands 45.9% of the time. The majority of searches don’t mention a company at all.

However, if we segment the data by business line we discover that most of the branded insurance searches are generic. Looking at each category of insurance, it’s clear that most people search without mentioning a specific company.
We can also zoom in on just the branded search segment to see which companies are top of mind across the entire insurance market.
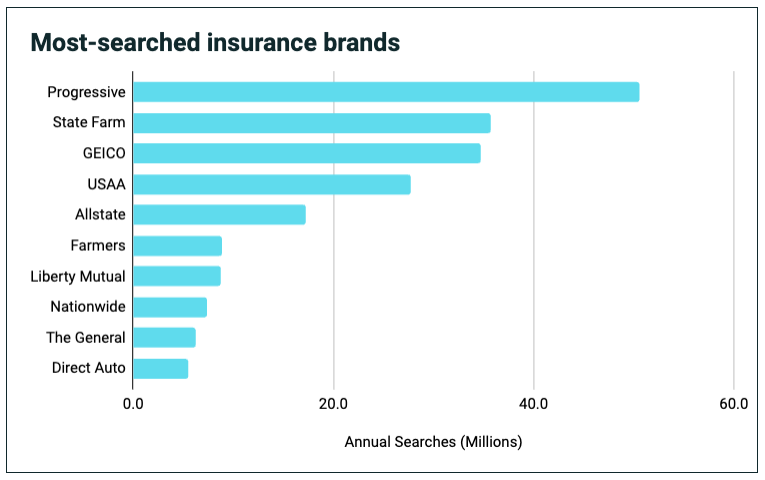
TAKEAWAY: Brand marketing is vital in a highly competitive industry like insurance. If you can get consumers to seek you out directly, you’ll win. However, it’s not the complete picture. As we saw from the first chart, 54.1% of consumers seek insurance information without mentioning a brand. This presents a massive opportunity to connect with new customers and grow market share.
Calculate market share more precisely
By translating searches into traffic we can determine any brand’s organic search market share within the insurance industry and how it changes over time. Let’s look at the five largest companies.
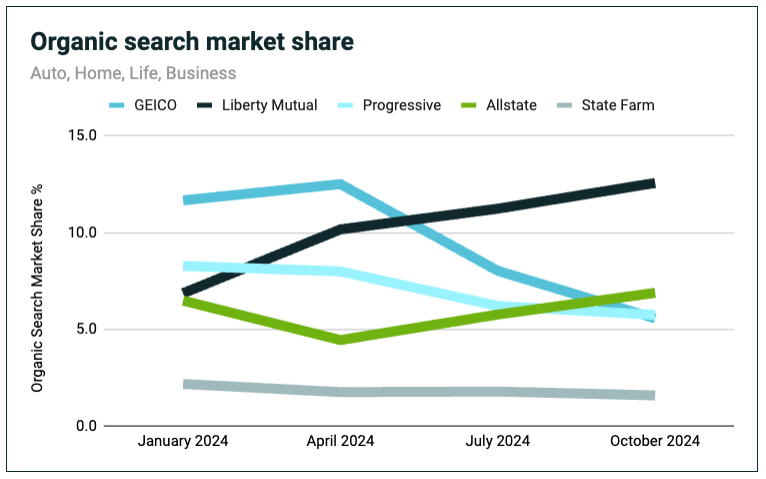
Additionally, we can segment the TAM by business line to see each company’s market share within a specific category at a single point in time.
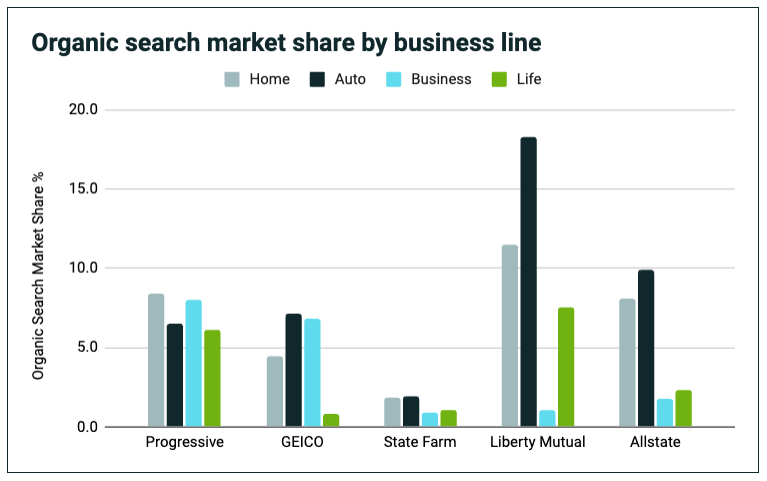
TAKEAWAY: By analyzing market share within the insurance TAM we can see which brands are gaining share over time, and which segments they’re winning in. For example, Liberty Mutual has the greatest opportunity to grow market share in the business insurance category, and State Farm has the greatest overall opportunity for growth.
Estimate traffic and revenue opportunities
Finally, we can use the data in the TAM to build models that predict traffic and revenue opportunities. For example, in the chart above we saw that State Farm had the biggest growth opportunity among the top five insurers. By calculating its non-branded organic web traffic vs Liberty Mutual, we can see that State Farm could add around 21 million new visits each year.
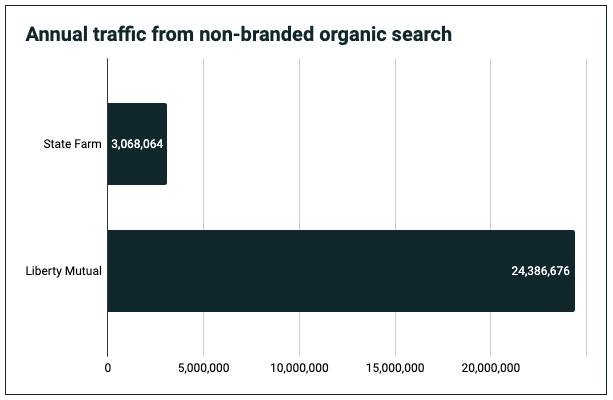
By estimating website conversion rates and annual policy values, we can also determine approximate revenue opportunities by business line.
Since Liberty Mutual has significantly less non-branded organic search market share than its competitors for business insurance, let’s look at the potential revenue opportunity vs the segment leader for commercial auto insurance.
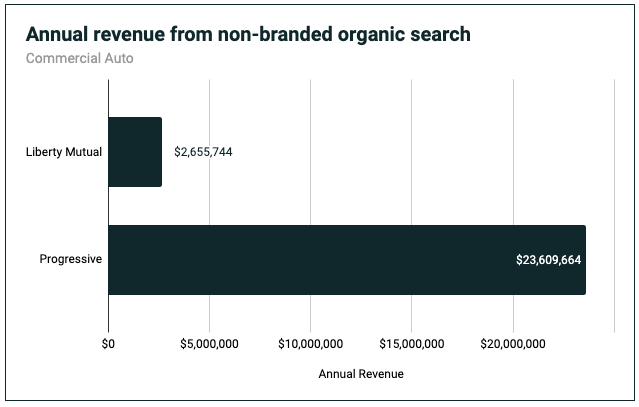
TAKEAWAY: Applying the Total Addressable Market framework to search data lets us see where we stack up against competitors, which areas we need to focus on, and how much revenue opportunity exists if we grow market share.
Taking action
Insights like these are a compass to guide business decisions. Terakeet can take them one step further and engineer an action plan that methodically translates millions of searches into customers for your business.
Contact Terakeet to see how our predictable revenue program can drive bottom-line growth for your business.


